

- Market News
Eurozone PMI Signals Contraction as War Fuels Inflation
The eurozone economy contracts in April as the Middle East conflict drives inflation higher and hammers services activity.
UK GDP Beats Expectations as Markets Eye US Jobs
UK GDP logs a fourth straight monthly gain while markets brace for US jobless claims and key central bank remarks.
Asian Markets Pause as US-Iran Ceasefire Optimism Fades
Asian markets paused on Thursday as fading US-Iran ceasefire hopes and elevated oil prices prompted caution across global markets.
Asian Markets Fall Amid Trump-Iran Tension Fears
Asian markets erased early gains Thursday after Trump warned of escalating U.S. action against Iran over the next weeks.


GBP/USD: The Bull Has an Edge; Let It Make a Move

- The pair trades within a horizontal channel
- Simple Moving Average 30 has been a support
- The H1 chart trades within a triangle; the price is at the resistance
- Intraday price action has been bullish
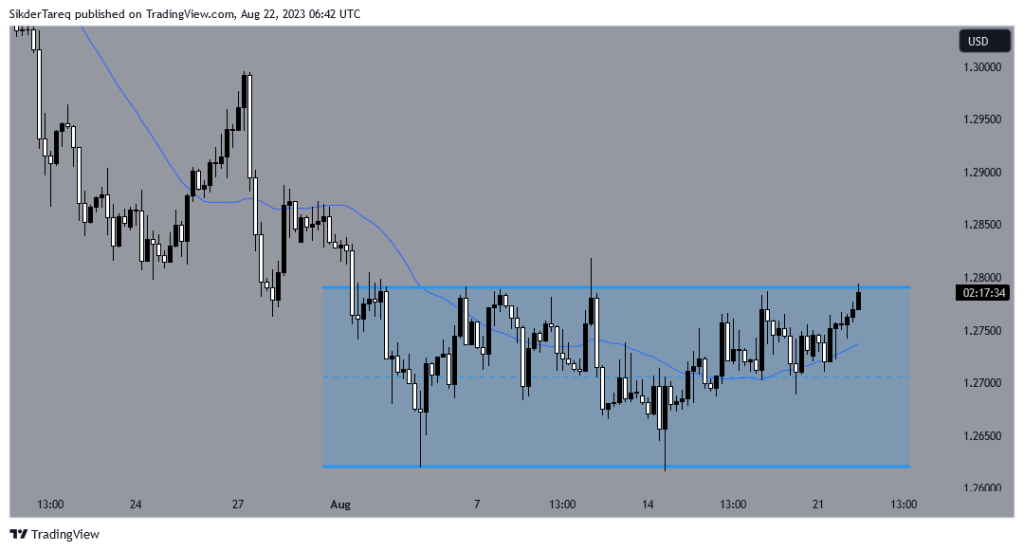
GBP/USD Gets Trapped within a Horizontal Channel
The pair had a bounce twice at 1.26000 and tried to get bullish. However, it found its resistance 1.28000 and had rejections several times. The chart shows that the price gets trapped within 1.26000-1.28000. As of writing, the price trades around the resistance of that channel. Simple Moving Average 30 acts as support. A bullish breakout at 1.28000 may push the price towards the North. The price may find its next resistance around 1.30000.
On the contrary, if 1.28000 works as resistance again and produces a bearish reversal pattern, intraday sellers may look to go short and drive the price towards channel’s support.
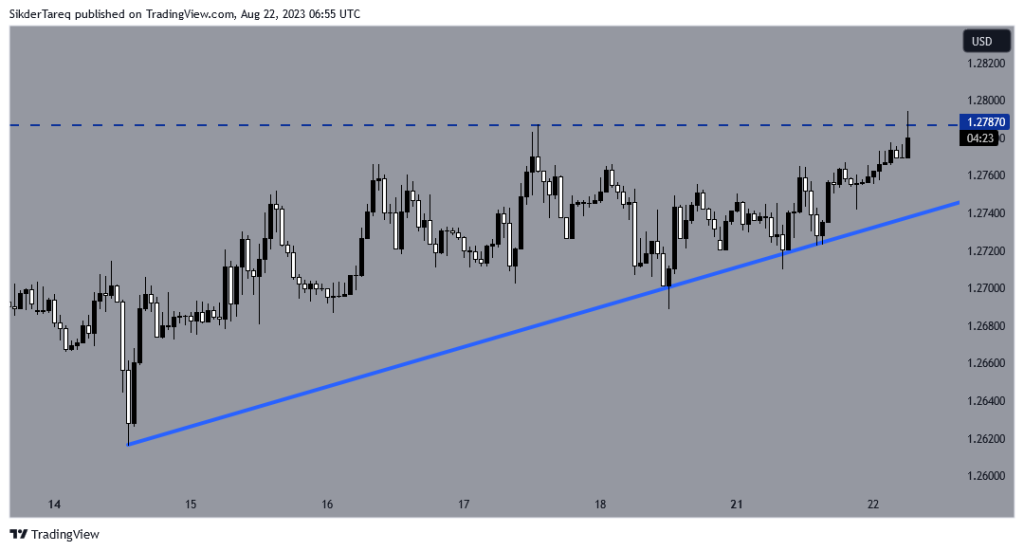
The H1 Chart Trades in Pennant
The H1 chart shows that the price has been heading towards the North with moderate pace. It had a rejection at 1.27870 last week. The price had reacted at the same level earlier as well. A pennant pattern is very evident. Thus, traders may keep an eye for a bullish breakout at horizontal resistance or a bearish breakout at pennant’s support. A bullish breakout at 1.27870 may push the price towards the North. The price may find its next resistance around 1.28350.
On the downside, if the price makes a bearish breakout at pennant’s support, it may head towards the South and find its next support around 1.26650.
The H4 chart is bullish-neutral. The H1 chart is neutral. Considering both charts, it seems that the Bull may win the race here. Traders are to wait here patiently for the pair to make a move and clarify its next bias.
Written by: Md Tareq Sikder, Senior Analyst Forex Prop News
Contact and follow Tareq on Twitter: @tareqfpn


Related Articles
Eurozone PMI Signals Contraction as War Fuels Inflation
The eurozone economy contracts in April as the Middle East conflict drives...
UK GDP Beats Expectations as Markets Eye US Jobs
UK GDP logs a fourth straight monthly gain while markets brace for...
Asian Markets Pause as US-Iran Ceasefire Optimism Fades
Asian markets paused on Thursday as fading US-Iran ceasefire hopes and elevated...
Asian Markets Fall Amid Trump-Iran Tension Fears
Asian markets erased early gains Thursday after Trump warned of escalating U.S....
Leave a comment