

- Market News
UK GDP Beats Expectations as Markets Eye US Jobs
UK GDP logs a fourth straight monthly gain while markets brace for US jobless claims and key central bank remarks.
Asian Markets Pause as US-Iran Ceasefire Optimism Fades
Asian markets paused on Thursday as fading US-Iran ceasefire hopes and elevated oil prices prompted caution across global markets.
Asian Markets Fall Amid Trump-Iran Tension Fears
Asian markets erased early gains Thursday after Trump warned of escalating U.S. action against Iran over the next weeks.
Mixed Signals Cloud Iran-US Talks as Markets Watch
Mixed messages from Tehran and Washington leave oil, bonds, and equities hanging by a fragile thread.


GBP/JPY: Choppy Price Action Makes Traders Wait
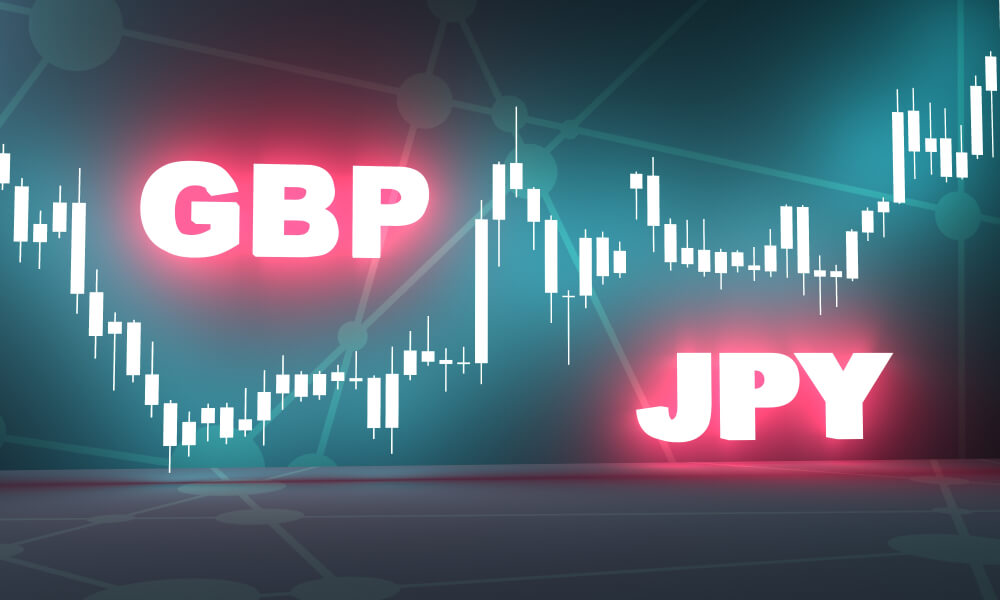
- GBP/JPY seems to be bearish on the H4 chart.
- The pair trades below the simple moving average 30.
- The H1 chart consolidates for quite a while.
- Intraday minor charts have exhibited choppy price movements.

GBP/JPY- Technical Analysis-H4 Chart
The H4 chart shows that the price made a bearish move earlier on the H4 chart. It had a strong bounce at 178.115. Then, it started having bullish correction. The sellers might have waited for the price to find its resistance around 180.940 to go short. However, the price did not react to that level. Instead, it breached it once, and then made a bearish move again. As of writing, the pair trades around that level. The sellers may wait for the price to produce a bearish reversal candle around 181.150. If the SMA 30 works as resistance around that horizontal level, it may generate good bearish momentum and drive the price towards the South. The price may find its support around 178.115 again.
On the upside, if the price breaches the SMA 30 and confirms the breakout, the buyers may wait for the price to produce a bullish reversal pattern at the value area to go long in the pair. The price may find its resistance around 182.450.

Price Action Analysis- H1 Chart
The chart shows that the price has been caught within 181.140-180.300. The price, at the last bounce produced a bullish candle and gradually moved towards the North. It then has found its resistance around 180.800. Minor charts traders seem to be very confused. The H1 traders must wait for the price to reach at the resistance 181.140 and produce a bearish reversal candle to offer them short entries. If the price continues its bearish move from where it is now, sellers may also look to go short below180.300.
On the upside, if the price breaches 181.140, the buyers may wait for the price to confirm the breakout followed by bullish reversal candle at the breakout level. In that case, the price may find its resistance around 182.000
Written by: Md Tareq Sikder, Senior Analyst Forex Prop News
Contact and follow Tareq on Twitter: @tareqfpn


Related Articles
UK GDP Beats Expectations as Markets Eye US Jobs
UK GDP logs a fourth straight monthly gain while markets brace for...
Asian Markets Pause as US-Iran Ceasefire Optimism Fades
Asian markets paused on Thursday as fading US-Iran ceasefire hopes and elevated...
Asian Markets Fall Amid Trump-Iran Tension Fears
Asian markets erased early gains Thursday after Trump warned of escalating U.S....
Mixed Signals Cloud Iran-US Talks as Markets Watch
Mixed messages from Tehran and Washington leave oil, bonds, and equities hanging...
Leave a comment