

- Market News
Geopolitical Tensions and Oil Prices Shake Global Markets
Rising geopolitical tensions and surging oil prices rattled global markets Thursday, with traders closely watching US unemployment claims for direction.
US NFP Report Dominates Thursday’s Global Economic Calendar
Thursday's economic calendar centers on the US NFP report, with markets watching jobs data and central bank speakers for direction.
Fed’s Hawkish Shift Pressures S&P 500 Outlook
The Fed's hawkish dot plot pressures the S&P 500, raising rate hike bets and clouding near-term market direction.
Global Markets Mixed as Fed Signals Possible Rate Hikes
Global markets traded mixed as Fed rate signals boosted U.S. futures, while investors monitored yields and economic outlook.


EUR/CAD: The Bull Getting Ready to Make a Move
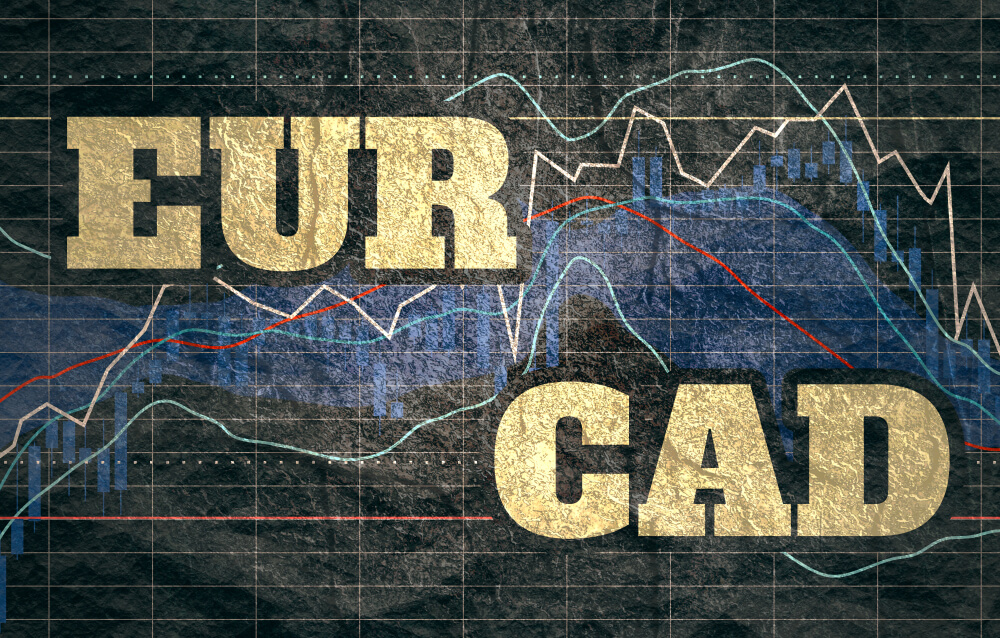
- EUR/CAD has had a bounce at a support level for the 2nd time.
- The last H4 candle closed within the SMA 30.
- The H1 chart looks very bullish.
- Intraday price action has been bullish as well.

EUR/CAD- Technical Analysis-H4 Chart
The H4 chart shows that the price had a bounce at 1.46000 and produced a bullish engulfing candle closing within the Simple Moving Average 30. The price had a bounce earlier at the same level. Thus, the buyers may wait for the price to make a breakout around 1.46675 to go long considering it as a double bottom. The price may then head towards the North and find its next resistance around 1.47300.
On the downside, if the SMA works as a resistance and produces a bearish reversal pattern, the sellers may look to go short on the pair. The sellers may consider taking a partial profit around 1.460000. A breakout below that level may drive the price towards the South further. In that case, the price may find its next support around 1.44850.

Price Action Analysis-H1 Chart
The H1 chart shows that the price has been heading towards the North in a hurry. At the last bounce, it produced a bullish inside bar. However, it created enough bullish momentum. The buyers did not wait to push the price towards the last swing high. As expected, the pair trades around the last swing high, but seems good to make a bullish breakout. A breakout above 1.46675 may push the price towards the North further with good momentum. The price may find its next resistance around 1.47000.
On the downside, the price may consolidate or make a bearish correction. It may find its support around 1.46400 or 1.46250. A bullish reversal pattern may attract the buyers again to go long and push the price towards the North again. However, a breakout below 1.45900 may create a different scenario. As things stand, it is far away to make a breakout at the last swing low.
The H4 chart looks neutral. However, the H1 chart looks good for the buyers. Thus, the bull may take over and make a move towards the upside. Let us wait and watch what price action does next.
Written by: Md Tareq Sikder, Senior Analyst Forex Prop News
Contact and follow Tareq on Twitter: @tareqfpn


Related Articles
Geopolitical Tensions and Oil Prices Shake Global Markets
Rising geopolitical tensions and surging oil prices rattled global markets Thursday, with...
US NFP Report Dominates Thursday’s Global Economic Calendar
Thursday's economic calendar centers on the US NFP report, with markets watching...
Fed’s Hawkish Shift Pressures S&P 500 Outlook
The Fed's hawkish dot plot pressures the S&P 500, raising rate hike...
Global Markets Mixed as Fed Signals Possible Rate Hikes
Global markets traded mixed as Fed rate signals boosted U.S. futures, while...
Leave a comment