

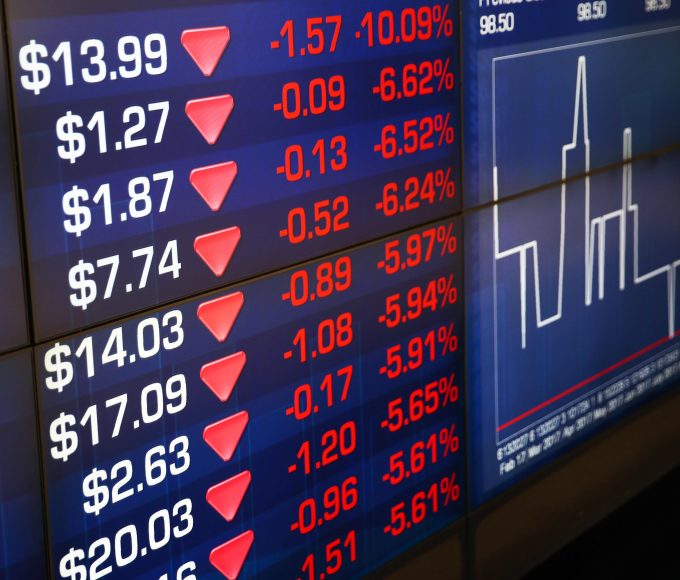
- Market News
UK GDP Beats Expectations as Markets Eye US Jobs
UK GDP logs a fourth straight monthly gain while markets brace for US jobless claims and key central bank remarks.
Asian Markets Pause as US-Iran Ceasefire Optimism Fades
Asian markets paused on Thursday as fading US-Iran ceasefire hopes and elevated oil prices prompted caution across global markets.
Asian Markets Fall Amid Trump-Iran Tension Fears
Asian markets erased early gains Thursday after Trump warned of escalating U.S. action against Iran over the next weeks.
Mixed Signals Cloud Iran-US Talks as Markets Watch
Mixed messages from Tehran and Washington leave oil, bonds, and equities hanging by a fragile thread.


EUR/GBP: Bear Dominates Eying to Break Lower Low

- EUR/GBP has been heading towards the South, the SMA 30 being a resistance.
- The pair has made a bearish breakout at the last swing low.
- The H1 chart looks good for the sellers.
- Intraday minor charts have been choppy in Tokyo session.

EUR/GBP – Technical Analysis- H4 chart
The chart shows that the price has been heading towards the South with decent pace. At the last rejection, it found its resistance at a horizontal level and produced a bearish engulfing candle. It has made a bearish breakout at 0.86600. The breakout level may play a vital role by being flipped resistance. The price consolidated at the minor charts. The H4 chart shows that the upon producing a bullish inside bar, the pair produced a bearish engulfing candle again.
The sellers may keep their eyes on the pair to go short. The price may find its next support around 0.86300.
The buyers may not find long opportunities soon in the pair. Unless, it makes a bullish breakout at the SMA 30 or it produces a double bottom, they should be patient with this pair.

Price Action Analysis- H1 Chart
The chart shows that the price has been heading towards the South by obeying a trend line. At the last rejection, it consolidated and produced a spinning top followed by a bearish engulfing candle. The next candle came out as strong bearish Marubozu candle breaching the level of 0.86600.
As of writing, the pair consolidates around the breakout level. A bearish reversal signal may attract the sellers to go short in the pair. The price may find its next support around 0.86400.
The buyers, on the other hand, may wait for the price to make a breakout at the trend line. A breakout followed by a bullish reversal signal may push the price towards the North. The price may find its resistance around 0.86900.
Written by: Md Tareq Sikder, Senior Analyst Forex Prop News
Contact and follow Tareq on Twitter: @tareqfpn


Related Articles
UK GDP Beats Expectations as Markets Eye US Jobs
UK GDP logs a fourth straight monthly gain while markets brace for...
Asian Markets Pause as US-Iran Ceasefire Optimism Fades
Asian markets paused on Thursday as fading US-Iran ceasefire hopes and elevated...
Asian Markets Fall Amid Trump-Iran Tension Fears
Asian markets erased early gains Thursday after Trump warned of escalating U.S....
Mixed Signals Cloud Iran-US Talks as Markets Watch
Mixed messages from Tehran and Washington leave oil, bonds, and equities hanging...
Leave a comment