

- Market News
US Midterms Weaken Dollar as BoE Decision Looms
The Democratic midterm victory pressured the dollar and oil, while gold recovered above $4,000 and the pound gained ground.
Iran Talks and Tech Worries Shape European Stocks
European stocks opened mixed Thursday as Spanish shares struggled, tech worries hit US futures, and Iran diplomacy gained attention.
SpaceX Surge Lifts Wall Street as Asia Slides
SpaceX revenue growth and Tesla merger discussions lifted US tech stocks Wednesday, while Asian markets fell and oil climbed.
Hot CPI Data and Inflation Fears Rattle Markets
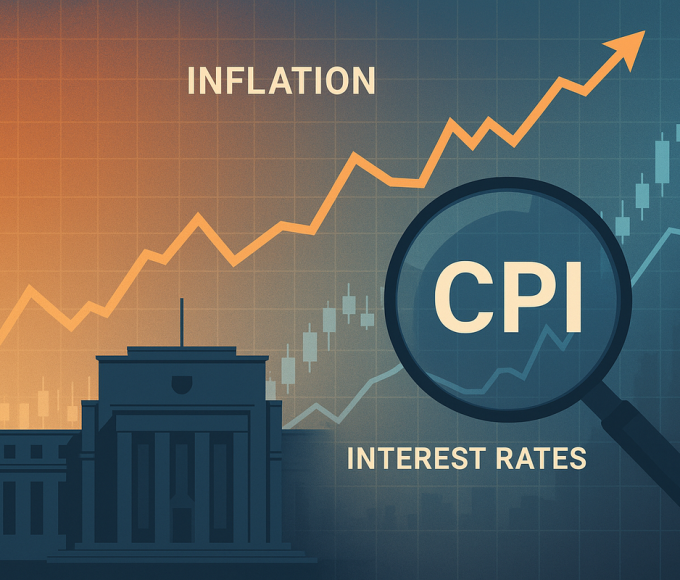
Hotter-than-expected September CPI data rattled global markets Wednesday, raising fears of a more aggressive Federal Reserve before the year ends.



- Market News
US Midterms Weaken Dollar as BoE Decision Looms
The Democratic midterm victory pressured the dollar and oil, while gold recovered above $4,000 and the pound gained ground.
Iran Talks and Tech Worries Shape European Stocks
European stocks opened mixed Thursday as Spanish shares struggled, tech worries hit US futures, and Iran diplomacy gained attention.
SpaceX Surge Lifts Wall Street as Asia Slides
SpaceX revenue growth and Tesla merger discussions lifted US tech stocks Wednesday, while Asian markets fell and oil climbed.
Hot CPI Data and Inflation Fears Rattle Markets
Hotter-than-expected September CPI data rattled global markets Wednesday, raising fears of a more aggressive Federal Reserve before the year ends.


S&P 500 and Russell 2000: Levels to Watch Pre-Thanksgiving
 Market NewsNovember 22, 20231 Mins read

Discover the S&P 500 pause at 4,540 and Russell 2000 key levels pre-Thanksgiving. Gain strategic insights for informed decision-making.
The FTSE 100 is consolidating below the previous week’s high of 7,535, facing resistance from the 55-day simple moving average (SMA) at 7,505. This consolidation comes amid a decline in US futures and Asian stocks following Nvidia’s earnings, signaling the end of the US earnings season before Thanksgiving. Despite capping the index, the uptrend persists, holding above the 7,446 low. The likelihood of revisiting the 7,516 high is higher than a reversal lower. If the index surpasses the November peak at 7,535, the 200-day SMA at 7,595 becomes the next target. Minor support levels include the November 9 high at 7,466, Tuesday’s low at 7,446, Thursday’s low at 7,430, and early September to early October lows at 7,384 to 7,369.
S&P 500 and Russell 2000: Levels to Watch Pre-Thanksgiving
S&P 500’s advance is stalling around the September peak of 4,540 after a sharp rally. The pause in upside momentum follows the release of Fed minutes indicating no inclination to cut rates by next May. A potential minor pullback before the extended Thanksgiving weekend could see a revisit to the mid-November high at 4,524. Additional support levels include the September 11 high at 4,491 and the August 24 high at 4,474. A breakthrough above this week’s high of 4,557 could set the stage for testing the July high of 4,607.
The Russell 2000, displaying a modest 2% positive performance year-to-date, is range-trading below its current November high of 1,833. Despite being the underperformer among US stock indices, it maintains a tight sideways range beneath its 200-day SMA and last week’s high at 1,822 to 1,833 leading up to Thanksgiving. The October-to-November uptrend remains intact, supported by Thursday’s low at 1,767. The 55-day SMA at 1,757 could act as additional support if revisited. Monday’s high of 1,813 serves as the observed immediate resistance. A breakthrough above the current 1,833 high would target the mid-September high 1,874.
Stay Updated with the Latest Market News. Visit our YouTube Channel for the Latest Forex Analysis.


Related Articles
US Midterms Weaken Dollar as BoE Decision Looms
The Democratic midterm victory pressured the dollar and oil, while gold recovered...
Iran Talks and Tech Worries Shape European Stocks
European stocks opened mixed Thursday as Spanish shares struggled, tech worries hit...
SpaceX Surge Lifts Wall Street as Asia Slides
SpaceX revenue growth and Tesla merger discussions lifted US tech stocks Wednesday,...
Hot CPI Data and Inflation Fears Rattle Markets
Hotter-than-expected September CPI data rattled global markets Wednesday, raising fears of a...
Leave a comment