

- Market News
Fed Hike and Yields Drive Thursday’s Global Markets
A unanimous Fed rate hike and climbing Treasury yields set the tone for Thursday's volatile global trading session ahead.
European Stocks Rally as Bond Markets Hold Steady
European stocks opened firmly higher Thursday as stabilising bond yields and falling oil prices gave markets room for a relief bounce.
Oil Tops $100 as Iran Conflict Rattles Markets
Surging oil prices above $100 and escalating Iran tensions rattled global markets Thursday, lifting gold and the Japanese yen sharply.
Fed’s Waller Speech and US ISM PMI Today
Fed's Waller takes centre stage Thursday alongside US ISM Services PMI data and weekly jobless claims in a packed session.




- Market News
Fed Hike and Yields Drive Thursday’s Global Markets
A unanimous Fed rate hike and climbing Treasury yields set the tone for Thursday's volatile global trading session ahead.
European Stocks Rally as Bond Markets Hold Steady
European stocks opened firmly higher Thursday as stabilising bond yields and falling oil prices gave markets room for a relief bounce.
Oil Tops $100 as Iran Conflict Rattles Markets
Surging oil prices above $100 and escalating Iran tensions rattled global markets Thursday, lifting gold and the Japanese yen sharply.
Fed’s Waller Speech and US ISM PMI Today
Fed's Waller takes centre stage Thursday alongside US ISM Services PMI data and weekly jobless claims in a packed session.


AUD/USD: Bull Halts at a Horizontal Resistance with the SMA 30’s Support
 forex_adminDecember 18, 20231 Mins read
- AUD/USD trades around 0.67250 a strong looking horizontal resistance.
- The pair trades around the simple moving average 30.
- The H1 chart is trapped within a horizontal channel.
- Intraday minor charts have been bullish.
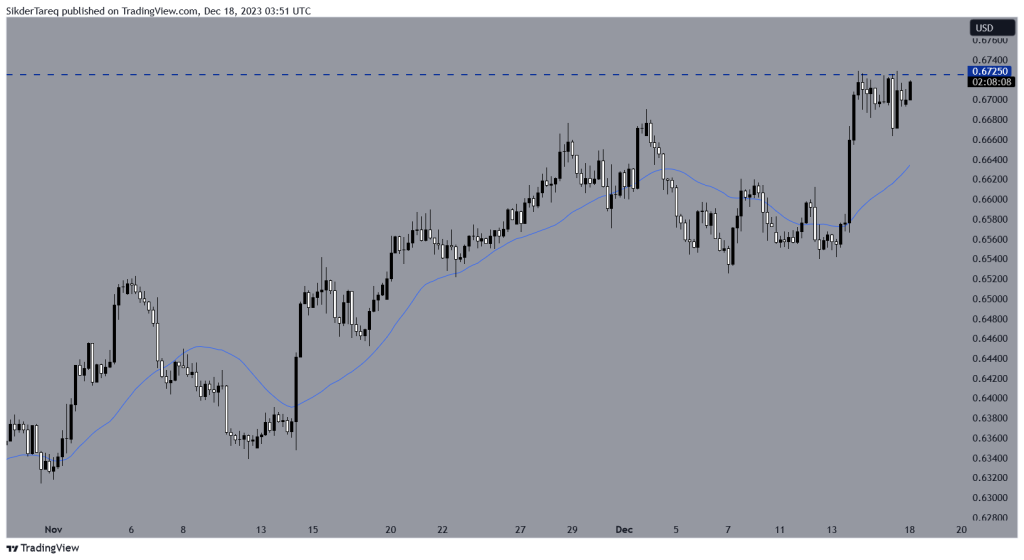
AUD/USD-Technical Analysis- H4 chart
The chart shows that the price made a strong bullish move on the H4 chart earlier. It found its resistance around 0.67250 and consolidated there for a while. Later, it produced a bearish engulfing candle. However, the sellers did not go short. Rather, the price headed towards the Upside. As of writing, the pair trades around the resistance again.
The buyers may wait for the price to make a breakout to go long in the pair. The price may find its next resistance around 0.68150. On the downside, if the pair produces a bearish reversal candle, the sellers may keep their eyes on the pair to go short below the SMA 30’s support.
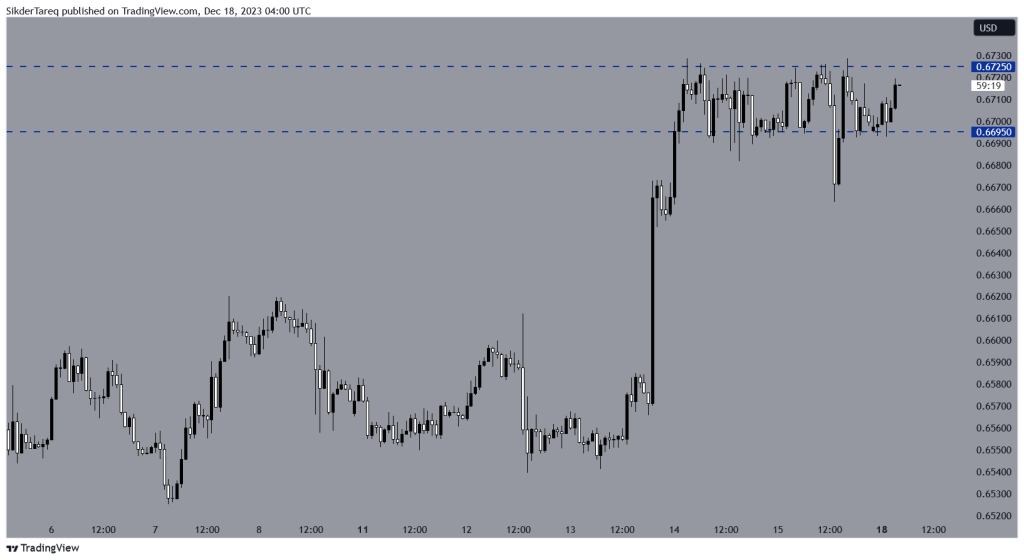
Price Action Analysis- H1 Chart
The chart shows that the price gets caught within 0.66950- 0.67250. At the last bounce, the chart produced an inverted hammer followed by a doji candle. Since then, the price has been bullish. Minor charts’ traders seem to be active to push the price towards the North. The buyers may keep their eyes to go long above the level of 0.67250. A breakout at the level followed by confirmation and bullish reversal may push the price towards 0.68000.
On the other hand, if the price makes a bearish breakout at 0.68950, the sellers may get themselves engaged to go short in the pair and drive it towards the South. The price may find its support around 0.65400.
Considering both charts, it seems that the buyers have an upper hand. The level of resistance on the H4 chart looks very strong though. If it continues to work as resistance, the pair may get bearish but it would take time. However, a bullish breakout at the resistance may make the pair bullish anytime again.
Written by: Md Tareq Sikder, Senior Analyst Forex Prop News
Contact and follow Tareq on Twitter: @tareqfpn



Related Articles
Fed Hike and Yields Drive Thursday’s Global Markets
A unanimous Fed rate hike and climbing Treasury yields set the tone...
European Stocks Rally as Bond Markets Hold Steady
European stocks opened firmly higher Thursday as stabilising bond yields and falling...
Oil Tops $100 as Iran Conflict Rattles Markets
Surging oil prices above $100 and escalating Iran tensions rattled global markets...
Fed’s Waller Speech and US ISM PMI Today
Fed's Waller takes centre stage Thursday alongside US ISM Services PMI data...
Leave a comment