

- Market News
Geopolitical Tensions and Oil Prices Shake Global Markets
Rising geopolitical tensions and surging oil prices rattled global markets Thursday, with traders closely watching US unemployment claims for direction.
US NFP Report Dominates Thursday’s Global Economic Calendar
Thursday's economic calendar centers on the US NFP report, with markets watching jobs data and central bank speakers for direction.
Fed’s Hawkish Shift Pressures S&P 500 Outlook
The Fed's hawkish dot plot pressures the S&P 500, raising rate hike bets and clouding near-term market direction.
Global Markets Mixed as Fed Signals Possible Rate Hikes
Global markets traded mixed as Fed rate signals boosted U.S. futures, while investors monitored yields and economic outlook.


EUR/CAD: Be Patient, Wait for the Breakout

- EUR/CAD has been choppy within the SMA 30’s resistance and a horizontal level.
- Traders are to be patient to find its next direction.
- The H1 chart has been choppy trading around yesterday’s low.
- Intraday minor charts are yet to find their direction.
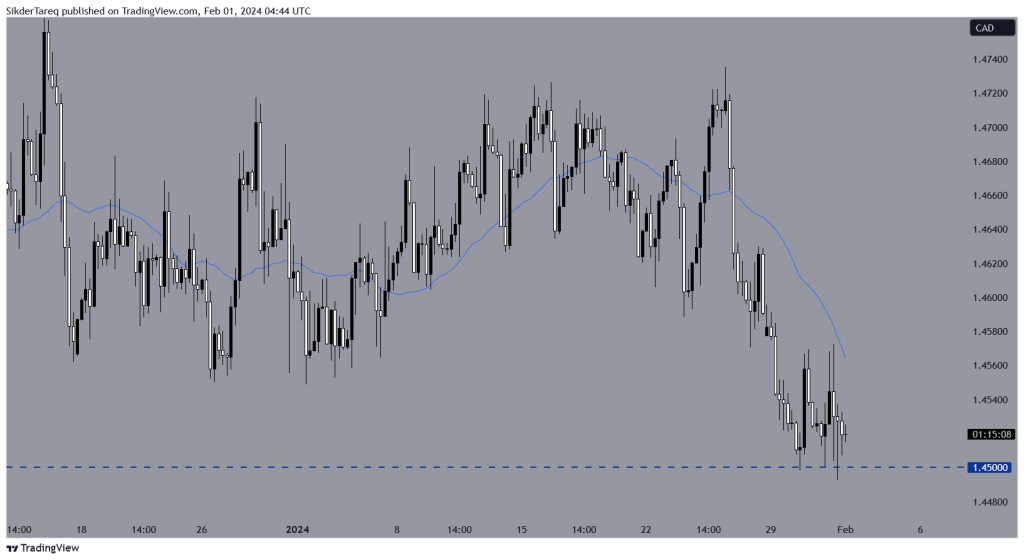
EUR/CAD- Technical Analysis- H4 Chart
The chart shows that the pair gets caught within the horizontal level 1.45000 and the simple moving average 30. The price had several bounces at the support level. Traders are to be patient to find its direction. A bearish breakout at the support level may drive the price towards the downside. The price may find its next support around 1.43350.
On the contrary, if the price breaches the SMA 30, the buyers may take over and push the price towards the North. If that happens, the bull may dominate in the pair for quite a while. It may find its resistance around 1.46250. Most probably, it may continue its bullish move and head towards the swing high later on.

Price Action Analysis- H1 Chart
The H1 chart tells a very similar story. On this chart, the price gets caught within a horizontal channel between 1.45700-1.45000. As of writing, the pair trades around the support level. Thus, it may make intraday traders be interested to push the price towards the upside. A breakout above the level of 1.45700 may make it more bullish. The price may find its resistance around 1.46300.
On the downside, if the price breaches the support level, the sellers will be keen to go short and drive it towards the downside. The price may find its next support around 1.44300.
Considering both charts, traders are to be patient here to find its next route. In fact, it may take some time to make the next breakout. One thing for sure, the next breakout is going to be very crucial to move the pair for some days.
Written by: Md Tareq Sikder, Senior Analyst Forex Prop News
Contact and follow Tareq on Twitter: @tareqfpn


Related Articles
Geopolitical Tensions and Oil Prices Shake Global Markets
Rising geopolitical tensions and surging oil prices rattled global markets Thursday, with...
US NFP Report Dominates Thursday’s Global Economic Calendar
Thursday's economic calendar centers on the US NFP report, with markets watching...
Fed’s Hawkish Shift Pressures S&P 500 Outlook
The Fed's hawkish dot plot pressures the S&P 500, raising rate hike...
Global Markets Mixed as Fed Signals Possible Rate Hikes
Global markets traded mixed as Fed rate signals boosted U.S. futures, while...
Leave a comment