

- Market News
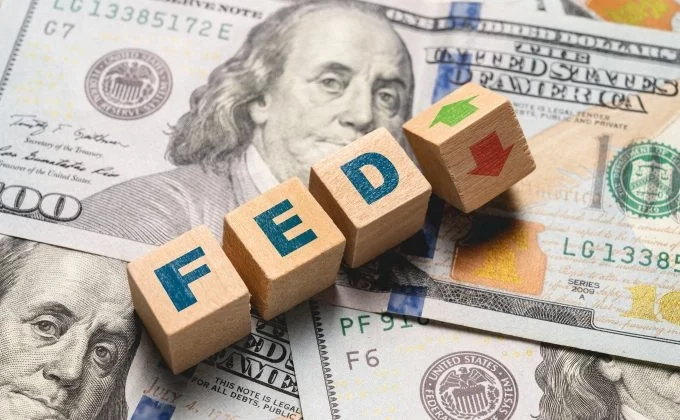
Fed Rate Hold Fuels Dollar Amid Global Market Volatility
Global markets navigate Fed policy uncertainty, oil volatility, and currency shifts as inflation pressures persist across major economies.
Germany’s Economy Contracts Again Amid Stagflation and Rising Costs
Germany's economy is on track to shrink in Q2 2026 as manufacturing slows and cost pressures intensify sharply.
UK GDP Beats Expectations Ahead of US Data
Strong UK GDP figures surprise markets ahead of key US retail sales and jobless claims releases on Thursday.
Global Markets Brace for Iran Deal, Fed Hold, and RBA Hike
Iran deal hopes lift equities while the Fed holds rates and the RBA delivers a surprise hike to 4.35%.


- Market News
Fed Rate Hold Fuels Dollar Amid Global Market Volatility
Global markets navigate Fed policy uncertainty, oil volatility, and currency shifts as inflation pressures persist across major economies.
Germany’s Economy Contracts Again Amid Stagflation and Rising Costs
Germany's economy is on track to shrink in Q2 2026 as manufacturing slows and cost pressures intensify sharply.
UK GDP Beats Expectations Ahead of US Data
Strong UK GDP figures surprise markets ahead of key US retail sales and jobless claims releases on Thursday.
Global Markets Brace for Iran Deal, Fed Hold, and RBA Hike
Iran deal hopes lift equities while the Fed holds rates and the RBA delivers a surprise hike to 4.35%.


GBP/NZD: Does the Bull Continue its Run or Find a New Support?

- The pair is in an uptrend on the H4 chart
- The price has had its second rejection at 2.15200
- Simple Moving Average 30 has been working as a support
- Intraday price action has been bearish so far

GBP/NZD The Bull Finds a Strong Fence
GBP/NZD pair has been up trending by obeying a bullish trend line on the H4 chart. Simple Moving Average 30 has been working as support as well. The buyers have pushed the price at its weakness. The price then had a rejection at 2.15200 yesterday. After the rejection, it had a bearish correction and found its support at 2.14000. The price headed towards the North with good momentum. However, it has found its resistance again and has produced a bearish engulfing candle. It suggests that the pair may make a bearish correction here. It is the second rejection, so the correction may be longer than the last one.
A bullish breakout at 2.15200 may attract buyers again. The price may find its next resistance around 2.17000.

A Bullish Trend Line is in Play
The H1 chart looks very lucrative for the buyers. The price has been up trending by obeying a bullish trend line. After having a double rejection at 2.15200, the price made a bearish correction. It seems to have found its support right at the trend line’s support. The chart produced a Spinning Top. As of writing, price action has been very bullish. If the current candle closes as a bullish engulfing candle, the buyers may go long in the pair and push the price towards the North further. A breakout above 2.15000 may add more fuel and push the price towards 2.16300 with good momentum.
On the contrary, if the price makes a bearish breakout at the trend line, intraday traders may look to go short in the pair. In case of a bearish breakout, the price may find its next support around 2.12500.
The H4 chart still favors the Bull. The H1 chart could go either way. A bearish breakout at the trend line may make it bearish. A bullish reversal at the trend line, on the other hand, may make it bullish. Considering both charts, it seems that the Bull is slightly ahead of the Bear.
Written by: Md Tareq Sikder, Senior Analyst Forex Prop News
Contact and follow Tareq on Twitter: @tareqfpn


Related Articles
Fed Rate Hold Fuels Dollar Amid Global Market Volatility
Global markets navigate Fed policy uncertainty, oil volatility, and currency shifts as...
Germany’s Economy Contracts Again Amid Stagflation and Rising Costs
Germany's economy is on track to shrink in Q2 2026 as manufacturing...
UK GDP Beats Expectations Ahead of US Data
Strong UK GDP figures surprise markets ahead of key US retail sales...
Global Markets Brace for Iran Deal, Fed Hold, and RBA Hike
Iran deal hopes lift equities while the Fed holds rates and the...
Leave a comment