

- Market News
AI Spending and Oil Prices Unsettle Global Markets
Heavy AI spending by tech giants and surging oil prices rattled global markets Thursday, with key earnings and data ahead.
UK GDP and US Retail Sales Drive Markets
UK GDP surprised to the upside Thursday as markets shifted focus toward US retail sales and jobless claims releases.
Geopolitical Tensions and Oil Prices Shake Global Markets
Rising geopolitical tensions and surging oil prices rattled global markets Thursday, with traders closely watching US unemployment claims for direction.
US NFP Report Dominates Thursday’s Global Economic Calendar
Thursday's economic calendar centers on the US NFP report, with markets watching jobs data and central bank speakers for direction.


NZD/JPY-Bull Has an Edge; Needs to Gather Momentum

- NZD/JPY has been bullish with moderate pace
- Simple Moving Average 30 has been a support
- Intraday price action seems bearish
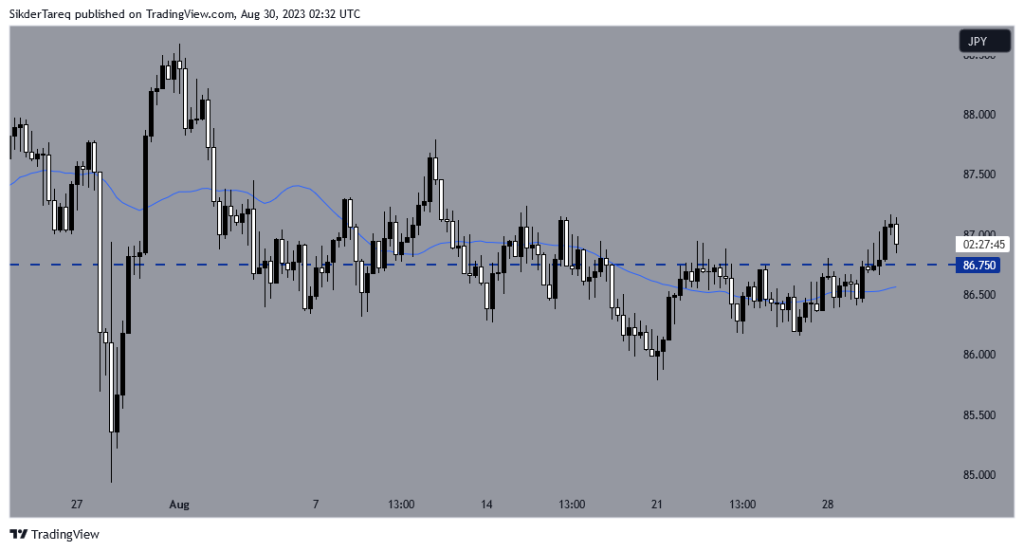
NZD/JPY Technical Analysis- H4 Chart
The pair has been heading towards the North on the H4 chart gradually. Buyers do not seem to be confident to buy the pair and push it towards the North with good momentum. However, Simple Moving Average 30 has been a support on the H4 chart. Thus, buyers may keep their eyes on the pair to go long from value areas. As of writing, the price seems to be bearish. The level of 86.750 may work as a flipped level of support. If the level holds the price and produces a bullish reversal pattern, the bull may make a strong move towards the upside. The price may find its next resistance around 87.750.
On the downside, the sellers may wait for the price to produce a double top or a bearish breakout at SMA 30 to look for short opportunities.
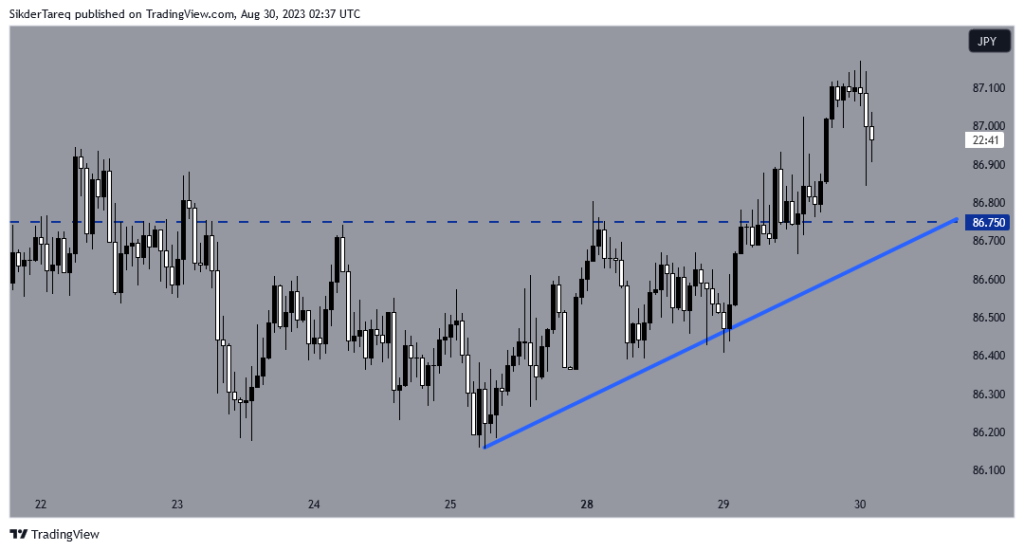
Price Action Analysis- H1 Chart
The chart shows that the price has been heading towards the North by obeying a bullish trend line. At the last bounce, it produced a bullish engulfing candle and moved towards the upside with strong momentum. On its way, it made a bullish breakout at 86.750. As of writing, the price has been making a bearish correction. Buyers are going to keep their eyes at the flipped level of horizontal support as well as at the trend line’s support to go long on the pair. The price may find its next resistance around 87.400.
On the downside, if the price makes a bearish breakout at trend line, the sellers may find short opportunities. The price may find its support around 86.400.
Technically, the H4 chart favors the bull. The H1 chart looks good for the buyers as well. Let us wait and watch how price reacts at those key levels.
Written by: Md Tareq Sikder, Senior Analyst Forex Prop News
Contact and follow Tareq on Twitter: @tareqfpn


Related Articles
AI Spending and Oil Prices Unsettle Global Markets
Heavy AI spending by tech giants and surging oil prices rattled global...
UK GDP and US Retail Sales Drive Markets
UK GDP surprised to the upside Thursday as markets shifted focus toward...
Geopolitical Tensions and Oil Prices Shake Global Markets
Rising geopolitical tensions and surging oil prices rattled global markets Thursday, with...
US NFP Report Dominates Thursday’s Global Economic Calendar
Thursday's economic calendar centers on the US NFP report, with markets watching...
Leave a comment