

- Market News
Fed Holds Rates as Tech Earnings Split Markets
The Federal Reserve held rates steady as mixed tech earnings and climbing Treasury yields sent global market sentiment in different directions.
AI Spending and Oil Prices Unsettle Global Markets
Heavy AI spending by tech giants and surging oil prices rattled global markets Thursday, with key earnings and data ahead.
UK GDP and US Retail Sales Drive Markets
UK GDP surprised to the upside Thursday as markets shifted focus toward US retail sales and jobless claims releases.
Geopolitical Tensions and Oil Prices Shake Global Markets
Rising geopolitical tensions and surging oil prices rattled global markets Thursday, with traders closely watching US unemployment claims for direction.


NZD/USD: Choppy Price Action, Bull May Come Along
- NZD/USD has been choppy on the H4 chart.
- The pair trades below Simple Moving Average 30.
- The H1 chart may be producing a Double Bottom.
- Intraday minor charts seem bullish.
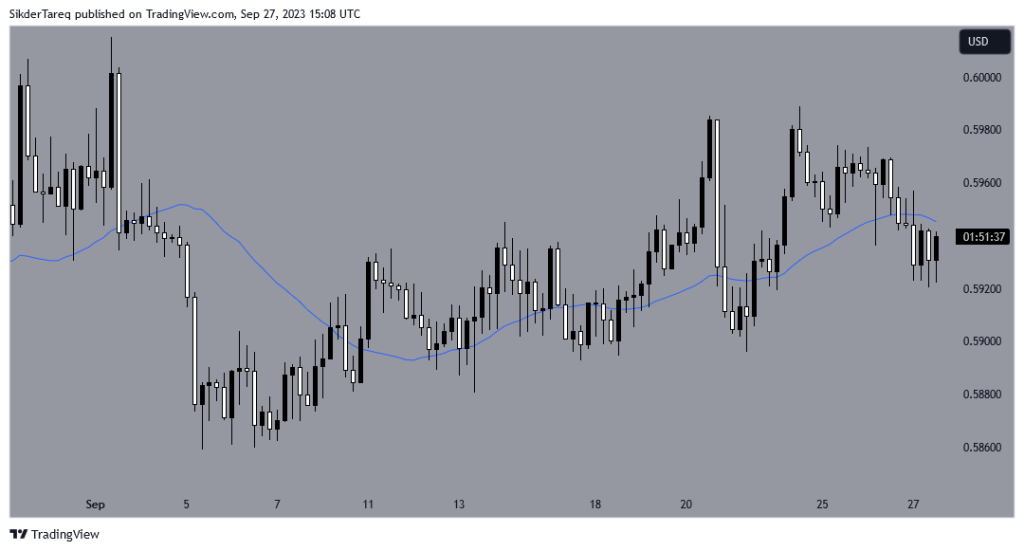
NZD/USD- Technical Analysis- H4 Chart
The pair seems to be trading around the simple moving average 30 for quite a while. As of writing, the pair trades below the SMA 30. However, since the price has not been reacting to the moving average, so it may not make an impact. The price consolidates. Traders may want to wait for the price to make a breakout at consolidation support or resistance to find some entries.
By looking at the H4 chart, it seems that traders have been struggling to find its direction. As things stand with the pair, it may not offer lucrative risk-reward on the H4 chart.
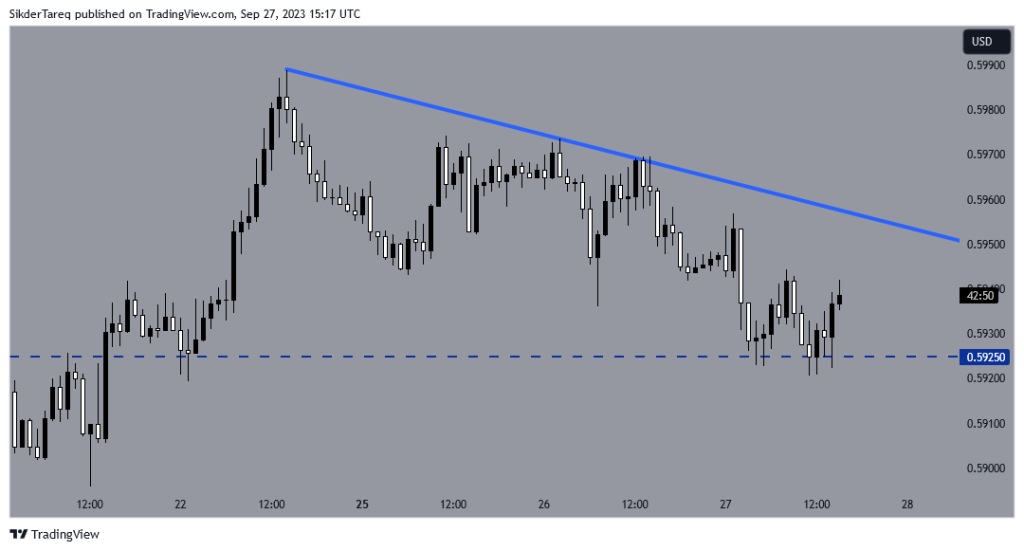
Price Action Analysis- H1 Chart
Price Action Analysis- H1 Chart
The chart shows that the price has been heading towards the South by obeying a trend line. It has found its support at 0.59250. The chart shows that the price reacted at this level several times. At the second bounce, it produced a bullish engulfing candle. However, the buyers may wait for the price to make a breakout at 0.59400 first. It would be considered as a neckline breakout. Since there is a bearish trend line, the buyers may not be sanguine unless it makes a bullish breakout at the trend line as well. If that happens, then the buyers may push the price towards the North. The price may find its resistance around 0.59800.
On the downside, if the price makes a bearish breakout at the horizontal support, the sellers may wait for the price to confirm the breakout followed by a bearish reversal pattern to go short in the pair. The price may find its support around 0.59000.
Written by: Md Tareq Sikder, Senior Analyst Forex Prop News
Contact and follow Tareq on Twitter: @tareqfpn


Related Articles
Fed Holds Rates as Tech Earnings Split Markets
The Federal Reserve held rates steady as mixed tech earnings and climbing...
AI Spending and Oil Prices Unsettle Global Markets
Heavy AI spending by tech giants and surging oil prices rattled global...
UK GDP and US Retail Sales Drive Markets
UK GDP surprised to the upside Thursday as markets shifted focus toward...
Geopolitical Tensions and Oil Prices Shake Global Markets
Rising geopolitical tensions and surging oil prices rattled global markets Thursday, with...
Leave a comment