

- Market News
Geopolitical Tensions and Oil Prices Shake Global Markets
Rising geopolitical tensions and surging oil prices rattled global markets Thursday, with traders closely watching US unemployment claims for direction.
US NFP Report Dominates Thursday’s Global Economic Calendar
Thursday's economic calendar centers on the US NFP report, with markets watching jobs data and central bank speakers for direction.
Fed’s Hawkish Shift Pressures S&P 500 Outlook
The Fed's hawkish dot plot pressures the S&P 500, raising rate hike bets and clouding near-term market direction.
Global Markets Mixed as Fed Signals Possible Rate Hikes
Global markets traded mixed as Fed rate signals boosted U.S. futures, while investors monitored yields and economic outlook.


USD/CAD: Bull Runs with Momentum

- USD/CAD has been heading towards the North with good momentum.
- The pair found its support at the SMA 30.
- The H1 chart looks bullish by obeying a trend line.
- Intraday minor charts have been bullish.
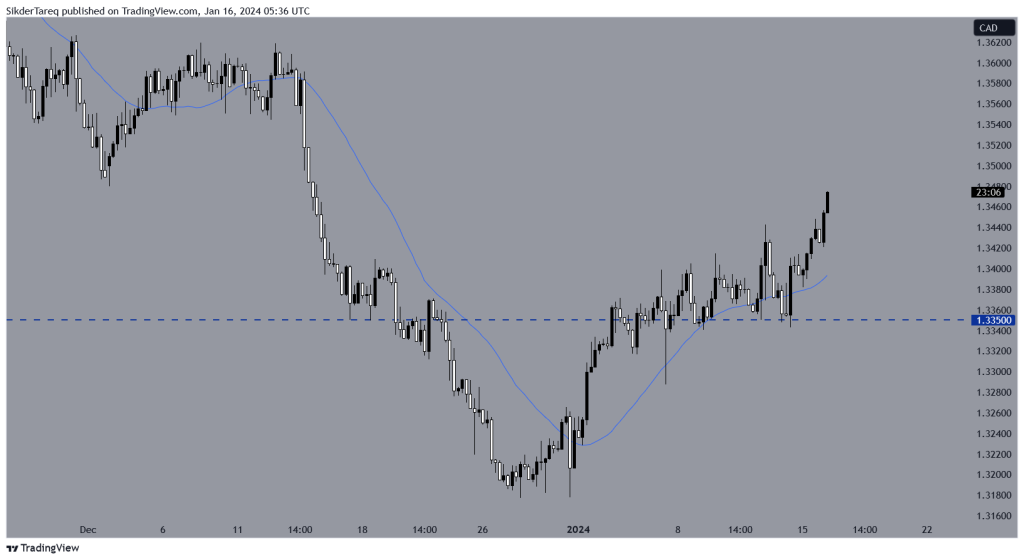
USD/CAD -Technical Analysis- H4 Chart
The chart shows that the price found its support at 1.33500 and produced a morning star. A bullish engulfing candle breached the SMA 30’s resistance and traded above for a while. Upon producing a hammer around the SMA 30, the pair has headed towards the upside. As of writing, the price has been very bullish. It may find its next resistance around 1.35500.
On the downside, the sellers may not find short opportunities soon with lucrative risk-reward. The chart is to produce a strong bearish reversal pattern such as double top to go short in the pair.
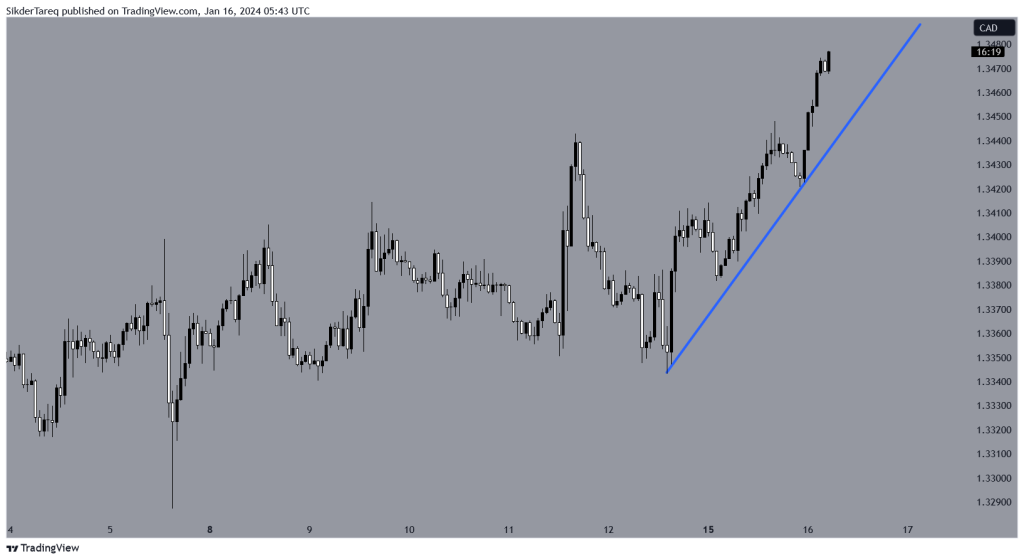
Price Action Analysis- H1 Chart
The chart shows that the price upon producing a double bottom made a strong bullish move. It then consolidated and made a bearish correction. At the flipped support, it made another bullish move and found its resistance around 1.34500. Upon having a correction, it found its support and produced a bullish engulfing candle before making another move. Those two lines can be added to draw a trend line.
The price action suggests that the buyers may keep their eyes to go long from the value areas.
On the downside, if the price produces a bearish reversal pattern followed by a breakout at the trend line, the sellers may find short opportunities. As things stand with the pair, it may take time. Thus, sellers must be patient with the pair for a while.
Written by: Md Tareq Sikder, Senior Analyst Forex Prop News
Contact and follow Tareq on Twitter: @tareqfpn


Related Articles
Geopolitical Tensions and Oil Prices Shake Global Markets
Rising geopolitical tensions and surging oil prices rattled global markets Thursday, with...
US NFP Report Dominates Thursday’s Global Economic Calendar
Thursday's economic calendar centers on the US NFP report, with markets watching...
Fed’s Hawkish Shift Pressures S&P 500 Outlook
The Fed's hawkish dot plot pressures the S&P 500, raising rate hike...
Global Markets Mixed as Fed Signals Possible Rate Hikes
Global markets traded mixed as Fed rate signals boosted U.S. futures, while...
Leave a comment