

- Market News
Fed Holds Rates as Tech Earnings Split Markets
The Federal Reserve held rates steady as mixed tech earnings and climbing Treasury yields sent global market sentiment in different directions.
AI Spending and Oil Prices Unsettle Global Markets
Heavy AI spending by tech giants and surging oil prices rattled global markets Thursday, with key earnings and data ahead.
UK GDP and US Retail Sales Drive Markets
UK GDP surprised to the upside Thursday as markets shifted focus toward US retail sales and jobless claims releases.
Geopolitical Tensions and Oil Prices Shake Global Markets
Rising geopolitical tensions and surging oil prices rattled global markets Thursday, with traders closely watching US unemployment claims for direction.


USD/CAD: The Price Gets Caught within a Rising Wedge
- The pair trades around a massive resistance in the H4 chart
- Simple Moving Average 30 has been working as a support
- The H1 chart produces a Rising Wedge Pattern
- Traders are to keep an eye on the next breakout
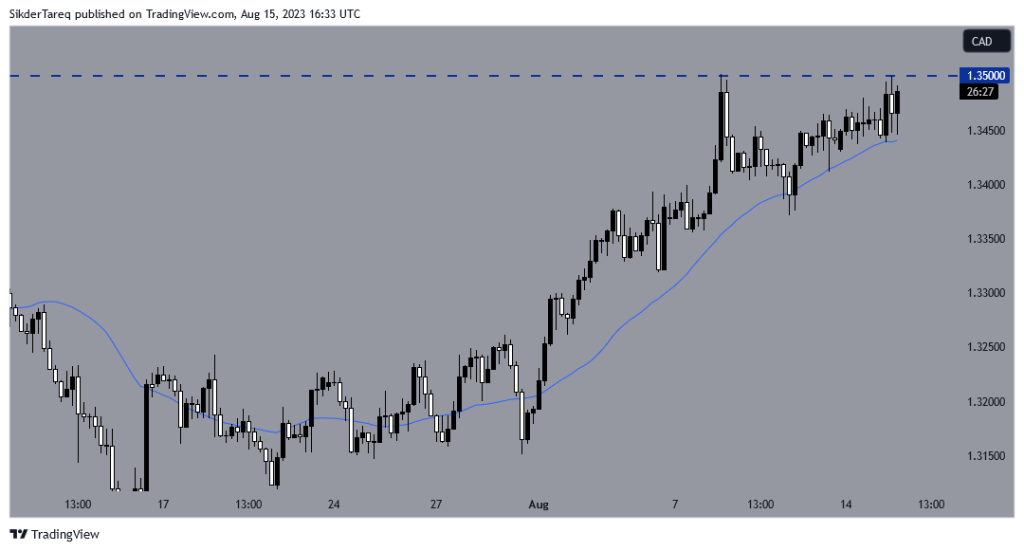
USD/CAD H4 Chart Finds a Massive Resistance
The pair has been up trending for some days. It had a rejection at 1.35000 last week and made a bearish correction. Simple Moving Average 30 has worked as a support and pushed the price towards the North. As of writing, the pair trades around that massive round number 1.35000. Thus, the pair has been sluggish for the last two H4 candles. The buyers may wait for the price to make a bullish breakout at the resistance and go long upon having breakout confirmation. The price may find its next resistance around 1.36350.
On the downside, if the price makes a breakout at Simple Moving Average 30, the price may head towards the South and remain bearish for a while. The pair may find its next support around 1.32500.
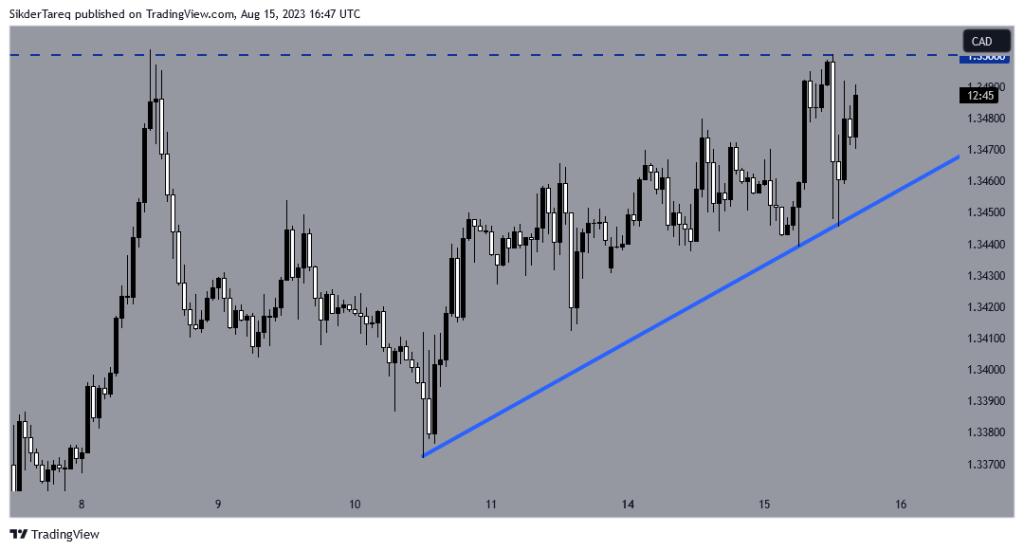
The H1 Chart Trades within a Rising Wedge
The H1 chart shows that the price has been up trending by obeying a bullish trend line. It had several bounces, so both the sellers and buyers are going to keep their eyes on the price action around the trend line. A bearish breakout below may attract the sellers to go short in the pair. The price may find its next support around 1.33750.
On the other hand, if the price makes a bullish breakout at the horizontal resistance, the pair may head towards the North and find its next resistance around 1.35800.
Considering both charts, the pair has is undeceive as of writing. The next breakout is going to determine its direction. Definitely, it is going to be a pair to keep an eye on for both the buyers and sellers. Let us wait and watch which way it makes its next breakout.
Written by: Md Tareq Sikder, Senior Analyst Forex Prop News
Contact and follow Tareq on Twitter: @tareqfpn


Related Articles
Fed Holds Rates as Tech Earnings Split Markets
The Federal Reserve held rates steady as mixed tech earnings and climbing...
AI Spending and Oil Prices Unsettle Global Markets
Heavy AI spending by tech giants and surging oil prices rattled global...
UK GDP and US Retail Sales Drive Markets
UK GDP surprised to the upside Thursday as markets shifted focus toward...
Geopolitical Tensions and Oil Prices Shake Global Markets
Rising geopolitical tensions and surging oil prices rattled global markets Thursday, with...
Leave a comment