

- Market News
Fed Holds Rates as Tech Earnings Split Markets
The Federal Reserve held rates steady as mixed tech earnings and climbing Treasury yields sent global market sentiment in different directions.
AI Spending and Oil Prices Unsettle Global Markets
Heavy AI spending by tech giants and surging oil prices rattled global markets Thursday, with key earnings and data ahead.
UK GDP and US Retail Sales Drive Markets
UK GDP surprised to the upside Thursday as markets shifted focus toward US retail sales and jobless claims releases.
Geopolitical Tensions and Oil Prices Shake Global Markets
Rising geopolitical tensions and surging oil prices rattled global markets Thursday, with traders closely watching US unemployment claims for direction.


USD/CHF: Bull is Slightly Ahead

- USD/CHF has been bullish on the H4 chart.
- The pair trades around the last week’s swing high.
- The H1 chart looks bullish.
- Intraday minor charts have been bullish.
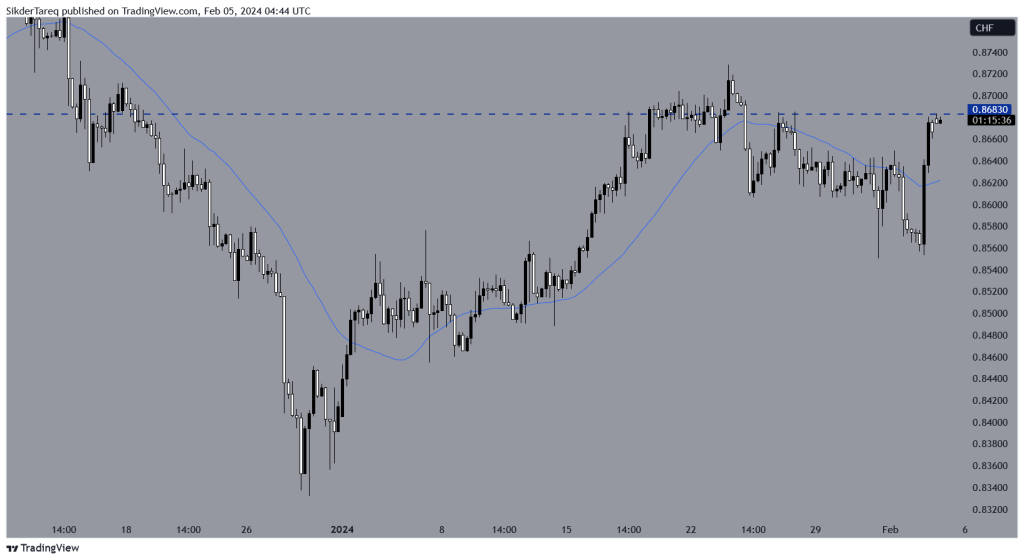
USD/CHF – Technical Analysis- H4 Chart
The chart shows that the price had a bounce at 0.85500 and produced a bullish engulfing candle breaching the simple moving average 30’s resistance. The price continued it move with one more candle. By looking at the chart, this should be counted as a double bottom formation. The price is in now consolidation. The level of 0.86830 has been working as a resistance. The buyers may be waiting for the price to go above the level to go long in the pair. The price may find its resistance around 0.88000.
On the contrary, if the level continues to work as a resistance, the sellers may wait for the price to breach the SMA 30’s support to find short opportunities. As thins stand, it may take time to happen.
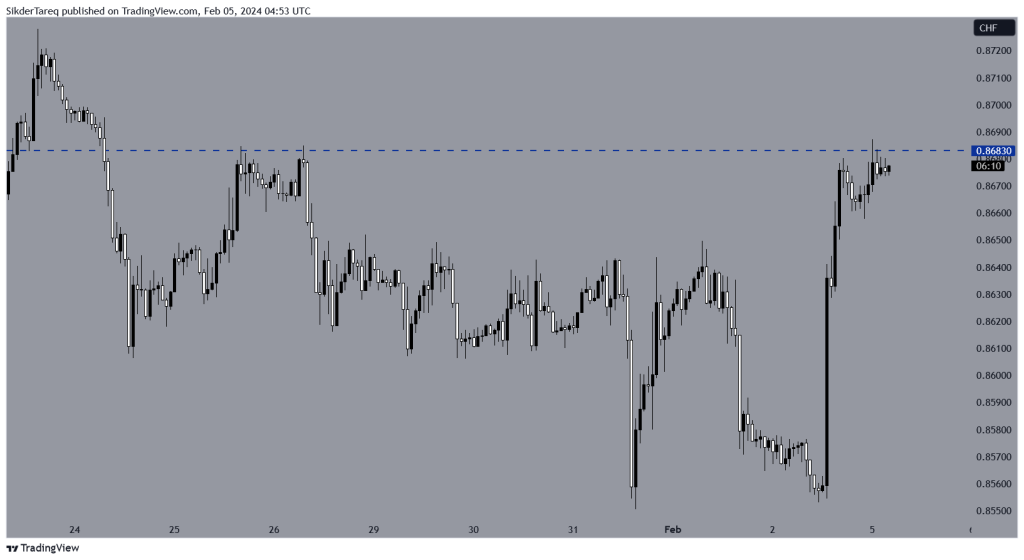
Price Action Analysis- H1 Chart
The chart shows that it made a strong bullish move on the H1 chart and had a rejection around 0.86830 earlier. The price then made a bearish correction and headed towards the North again. As of writing, the pair trades around that resistance zone again. The price action suggests that the bull has an upper hand here. A breakout above the level may push the price towards the North.
However, considering the strength of resistance, it is very likely that the pair may get bearish from here. A breakout below the level of 0.85560 will be considered as a neckline breakout of a double top. Thus, the sellers may wait to for a breakout there and go short in the pair. The price may find its next support around 0.86200.
Written by: Md Tareq Sikder, Senior Analyst Forex Prop News
Contact and follow Tareq on Twitter: @tareqfpn


Related Articles
Fed Holds Rates as Tech Earnings Split Markets
The Federal Reserve held rates steady as mixed tech earnings and climbing...
AI Spending and Oil Prices Unsettle Global Markets
Heavy AI spending by tech giants and surging oil prices rattled global...
UK GDP and US Retail Sales Drive Markets
UK GDP surprised to the upside Thursday as markets shifted focus toward...
Geopolitical Tensions and Oil Prices Shake Global Markets
Rising geopolitical tensions and surging oil prices rattled global markets Thursday, with...
Leave a comment