

- Market News
UK GDP and US Retail Sales Drive Markets
UK GDP surprised to the upside Thursday as markets shifted focus toward US retail sales and jobless claims releases.
Geopolitical Tensions and Oil Prices Shake Global Markets
Rising geopolitical tensions and surging oil prices rattled global markets Thursday, with traders closely watching US unemployment claims for direction.
US NFP Report Dominates Thursday’s Global Economic Calendar
Thursday's economic calendar centers on the US NFP report, with markets watching jobs data and central bank speakers for direction.
Fed’s Hawkish Shift Pressures S&P 500 Outlook
The Fed's hawkish dot plot pressures the S&P 500, raising rate hike bets and clouding near-term market direction.


USD/CHF: Traders are to be Watchful to Make Trading Decisions
- USD/CHF is trapped within an equidistant channel on the H4 chart.
- The pair trades above the SMA 30’s support and around the channel’s support as well.
- The H1 chart looks to be having consolidation.
- Intraday minor charts have been choppy.
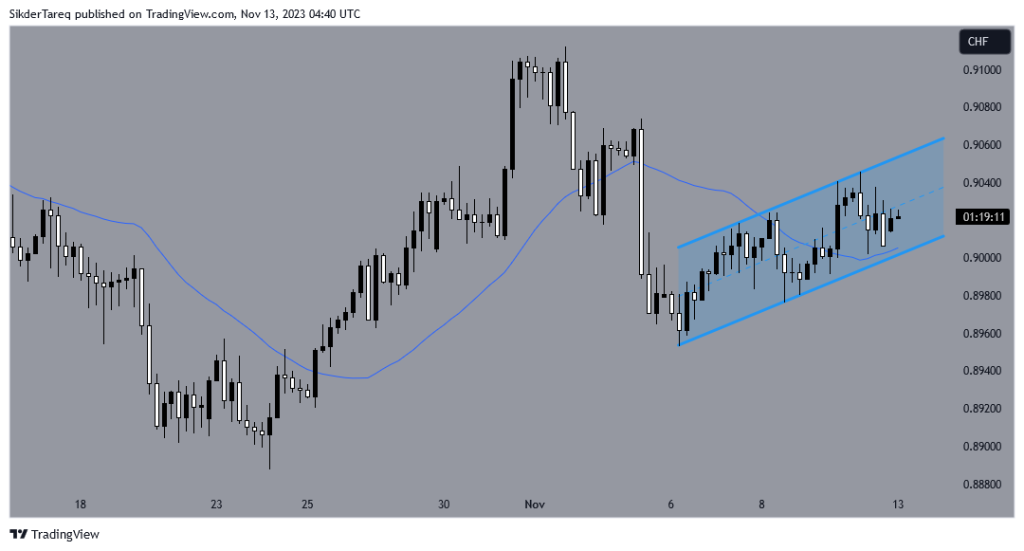
USD/CHF – Technical Analysis- H4 chart
The chart shows that the price has been roaming around an equidistant channel. As of writing, it trades around the channel’s support. Moreover, the simple moving average 30 has been working as its support as well. Thus, the buyers may keep their eyes on the pair to go long from this area and push the price towards the North. Channel’s resistance would be an area where the buyers may consider to take their profit out.
However, since the chart has found two support levels here, thus it may end up making a breakout at the channel’s resistance. A breakout followed by a confirmation may push the price towards the North. The price may find its resistance around 0.91000.
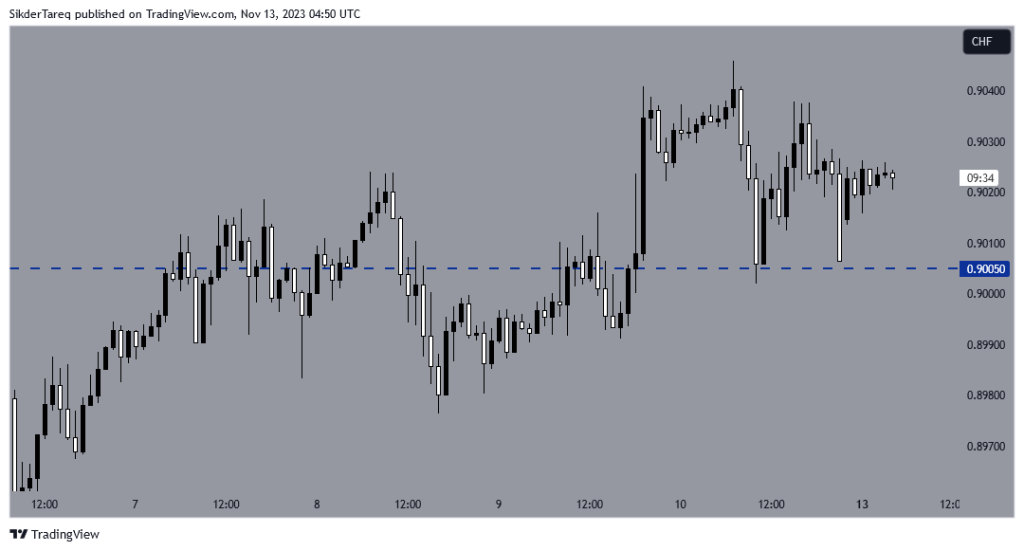
Price Action Analysis- H1 Chart
The chart shows that the prie had its second bounce around 0.90050 area. At the second bounce, it produced a bullish inside bar with an adjustment. Since then, it has been on consolidation. The price may continue its move towards the North and find its resistance around 0.90450.
On the contrary, if the price breaches the support, the seller may keep their eyes on the pair to go short. A bearish breakout followed by a bearish reversal pattern at the breakout level may drive the price towards 0.89750.
Considering both charts, it seems that traders are to be very watchful before making any trading decision. The bull is slightly ahead than the bear. Let us wait and watch whether it can use its resources.
Written by: Md Tareq Sikder, Senior Analyst Forex Prop News
Contact and follow Tareq on Twitter: @tareqfpn


Related Articles
UK GDP and US Retail Sales Drive Markets
UK GDP surprised to the upside Thursday as markets shifted focus toward...
Geopolitical Tensions and Oil Prices Shake Global Markets
Rising geopolitical tensions and surging oil prices rattled global markets Thursday, with...
US NFP Report Dominates Thursday’s Global Economic Calendar
Thursday's economic calendar centers on the US NFP report, with markets watching...
Fed’s Hawkish Shift Pressures S&P 500 Outlook
The Fed's hawkish dot plot pressures the S&P 500, raising rate hike...
Leave a comment